Use and assessment of growth curves in consultation and choice of treatment strategy
Growth curves in pediatrics
Growth curves, also known as percentile curves, have been used in pediatrics for years. They are based on statistically collected data that compares the height and weight of children with those of children of the same age. These curves can be used to determine whether a child is too tall or too short or whether they are underweight or overweight. This enables effective communication with parents about the child’s developmental status and the derivation of necessary measures to minimize risk, for example in the case of weight anomalies.
Growth curves for children’s eyes
Various growth curves from Asia and Europe are now available for assessing eye length growth in children’s eyes. When using these curves, it is important to note that this is a statistical evaluation of the distribution in the respective population group, which leads to considerable differences between the curves from Asia and Europe.
Due to the significantly higher prevalence and more pronounced extent of myopia in the Asian population compared to the European population, the correlation between higher percentiles of eye length (AL) and myopia is more pronounced in Asia. As a result, the 75th percentile of eye length in Chinese studies is comparable to the 98th percentile in European studies for both sexes [1 Diaz, 2 Tidemann].
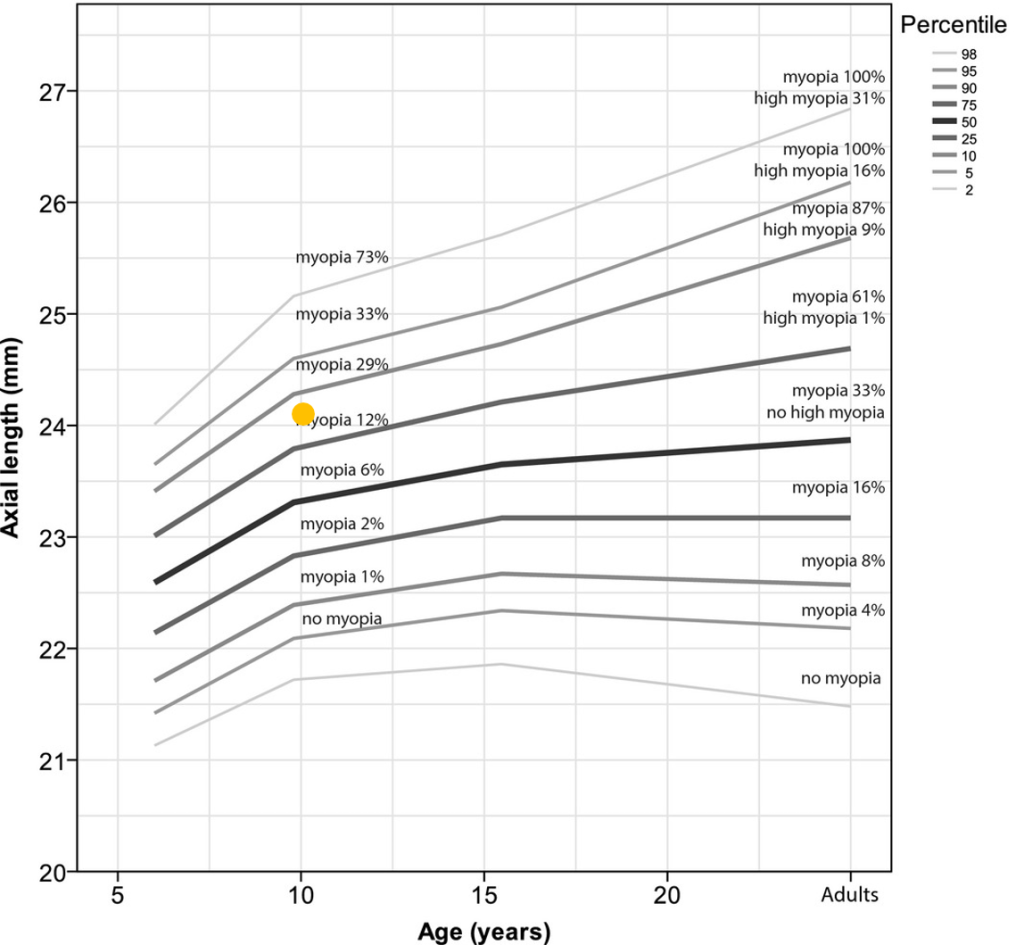
The most commonly used growth curve in myopia management comes from the 2018 study by Tidemann et al.[2]. Dr. Tidemann and his team analyzed data from cohorts in England and the Netherlands with over twelve thousand participants to create this growth curve. The Tideman percentiles presented here are median values and should not be interpreted directly as risk curves for myopia. Median values indicate how many of the test subjects had this eye length. The 50th percentile therefore indicates that exactly half of the children had an eye length below or above this line.
Since the percentiles alone do not provide meaningful information about the risk of a possible eye disease, Tidemann et al. added an additional subdivision of the degree of myopia, which distinguishes between no myopia, myopia and high myopia below -6 dpt [2].
Eye lengths around the 50th percentile (highlighted in bold in Figure 1) in adults are approximately 24 mm and are considered a normal, natural risk. The risk of complications continues to increase up to the 90th and 95th percentiles, respectively, reaching a threshold value in adulthood of around 26 mm, which is referred to as high myopia by Tideman at -6 dpt and above. However, in its report published in 2016, the WHO defined high myopia as -5 dpt and higher. Above this threshold, the risk of possible pathological changes due to myopia increases significantly [3 WHO].
In Switzerland, the List of Medical Aids (MiGeL) has regulated the services covered by compulsory health insurance for myopia management since July 2025. The limitations also specify the threshold value of -5 dpt for coverage and an above-average eye length for reimbursement for treatment with glasses and contact lenses that have been proven to inhibit myopia progression. The guidelines of the Swiss Ophthalmological Society (SOG) have therefore defined a curve for the limitation that reflects the threshold value of -5 dpt [4 MiGeL].
Figure 1 shows an orange dot indicating an area with enhanced health risk, ranging from 25 to 26 mm in adulthood.
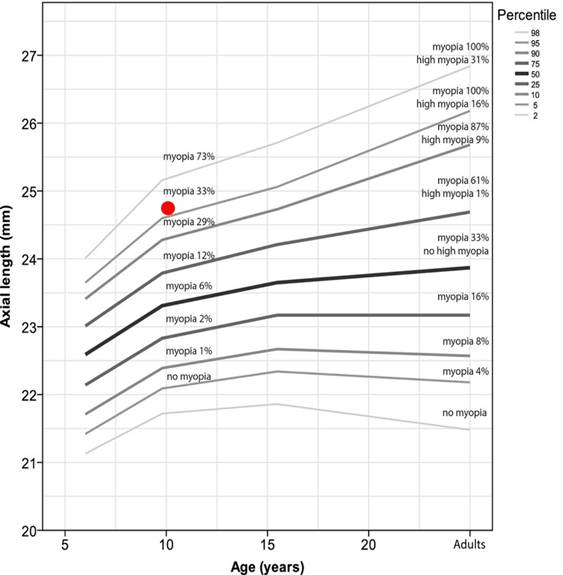
Figure 2 shows that the red dot is above the 95th percentile. According to Tideman et al., there is a high risk of eye disease and myopia in adulthood [2].
Myopia.Care Online growth curves for visualization, evaluation and consultation
Various websites and biometers provide such curves for easy visualization and assessment. Myopia.Care is one of the first platforms to support communication and counseling in myopia management. It offers a freely accessible way to assess axial eye length. In addition, Myopia.Care offers the possibility to calculate the course of a refraction in the future with the curves of Myappia by Dr. Thomas Aller and a questionnaire for risk analysis.
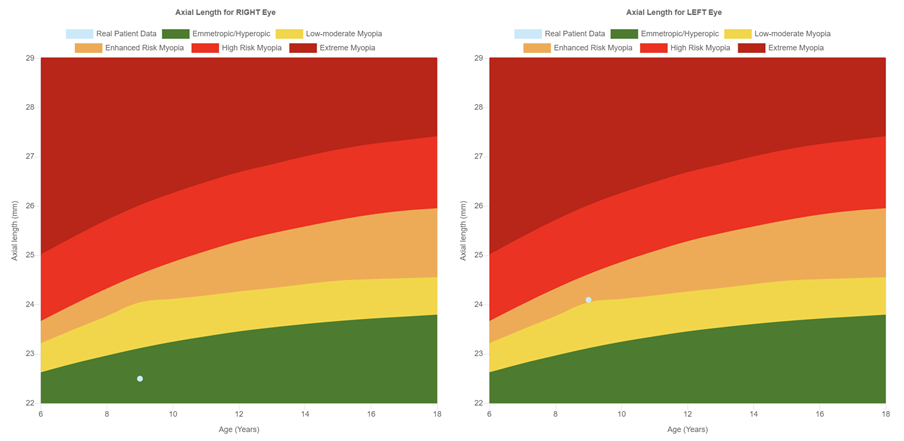
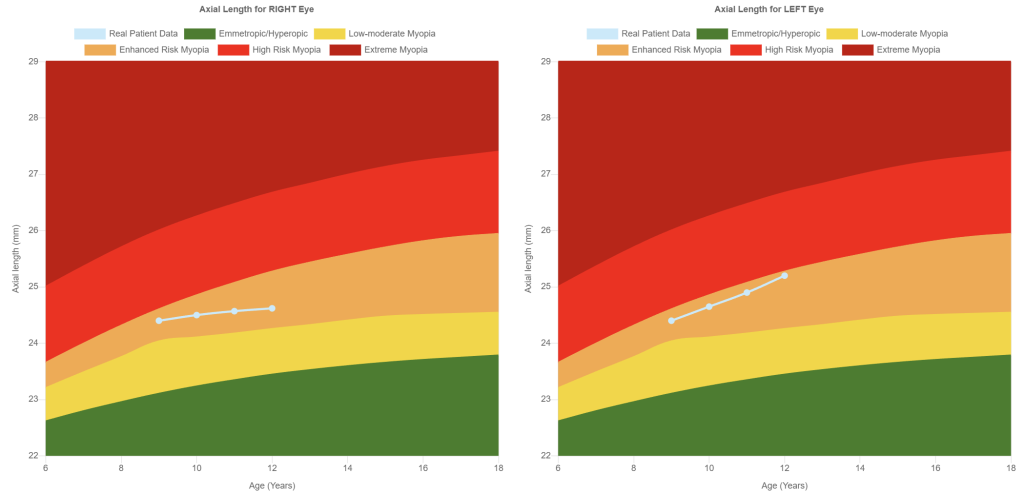
The growth curves from Myopia.Care are based on the principles of Tideman et al. (2018) [2] and the Swiss guidelines on MiGeL limitation [4]. To visualise the risk of myopia in a simple and understandable way, this data has been colour-coded using a traffic light system.
The color coding considerably simplifies communication and the selection of possible treatment strategies. A measurement point in the green area (see first image in Figure 3) corresponds to emmetropia or hyperopia, while measurement points in the orange, red and dark red areas (see second, third and fourth images in Figure 3) indicate myopia with different risk levels.
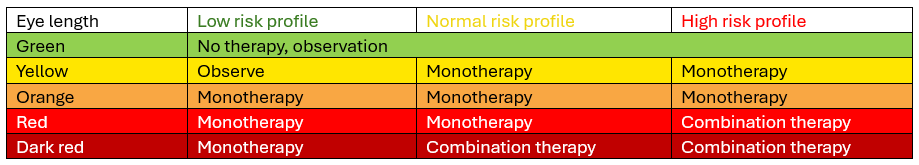
Treatment strategy using Myopia.Care Color Indication table
In evidence-based myopia management, each child must be assessed individually, as not only the measured values, but also environmental factors and lifestyle habits influence the treatment strategy in myopia management. The color coding in the Myopia.Care curves can help to simplify the strategy determination. Eyes in the green area should be observed to determine whether the growth follows the curve or increases more rapidly. In the yellow zone, treatment can be considered, although if the risk profile is low to moderate, it is also possible to wait and see, depending on the risk profile. The curve within the orange area marks the area in which the MiGeL limitations for specific health insurance benefits for myopia management in Switzerland apply [4]. If the eye length is already in the orange or red area, monotherapy is recommended. However, combination therapy may also be considered for high-risk profiles. If the eye is already in the dark red area, it may be advisable to start combination therapy immediately so as not to lose any time. The risk profile can be determined by using the public questionnaire on Myopia.Care.
The table below, which is a component of the eye length traffic light system, offers a potential method for formulating a strategy and includes a score for evaluating the risk profile.
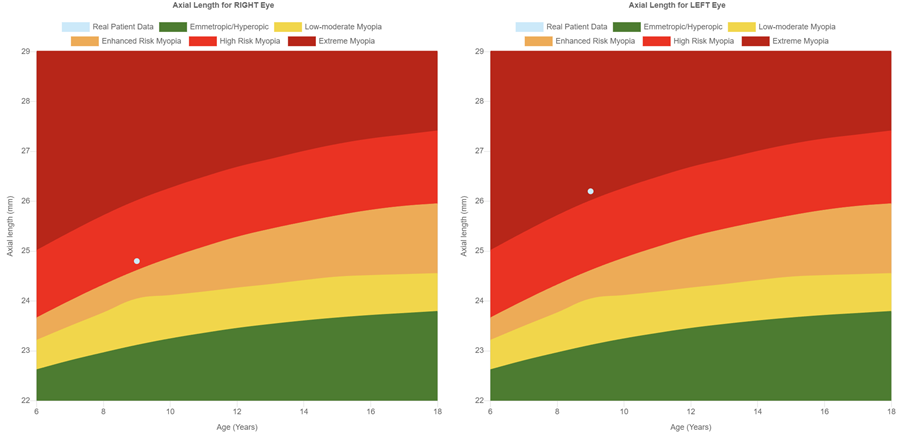
After 6 to 12 months, the treatment strategy should be reviewed based on the progression and growth pattern and adjusted if necessary. The progression shows the development of progression over time, whereby both a slight progression (first image in Figure 4) and an increase (second image) in eye length can be recognized. These observations allow an objective assessment of progression and treatment success.
Use of the Myopia.Care growth curve
The “Growth curve” page can be selected from the menu via the link www.myopia.care. Here you will find the required input fields for age, eye length right and left and gender to create the growth curves. It is also possible to enter historical values in order to display the progression graphically. Patient data is not saved in the public version. Saving patient data and history is only possible as part of a subscription membership.
Statement from Dr. Thomas Aller
The new treatment color indication system, as outlined in the recent article, represents a significant advancement in the management of myopia progression. By utilizing distinct colors, we can simplify the recommendation of treatment strategies for both clinicians and patients. This intuitive visual aid enhances our ability to communicate the need of treatment based on individual patient risks.
In conclusion, the new color indication system and the Myopia.Care growth curve tool are instrumental in improving treatment outcomes and fostering a collaborative approach to myopia management. We are committed to continually refining these tools to better serve our patients and advance the field of myopia control.
Dr. Thomas Aller, Board Member MyopiaCare
Statement by Dr Michael Baertschi, PhD
The clinically useful colour-coded gradations of Myopia.Care help us in our daily practice to respond quickly, easily and clearly to the individual myopia situation of each child. The clear grading system and clinically proven treatment recommendations help us to make an objective assessment and to inform and advise those affected and their parents. A successful tool for us practitioners.
Dr. Michael Baertschi, PhD, Eyeness AG, Switzerland, Consultant
Disclaimer:
The color-coded indications shown in the growth curves and MCCI table of Myopia.Care serve solely as orientation aids and do not constitute a diagnosis or therapeutic recommendation. An ophthalmological assessment is essential to ensure a well-founded and individualized treatment. Only a detailed examination by a specialist can provide the necessary information to select the best therapy option.
References:
- Sanz Diez P, Yang LH, Lu MX, et al. Growth curves of myopia-related parameters to clinically monitor the refractive development in Chinese schoolchildren. Graefes Arch Clin Exp Ophthalmol. 2019 May;257(5):1045-1053. doi: 10.1007/s00417-019-04290-6. Epub 2019 Mar 23. PMID: 30903312.
- Tideman JWL, Polling JR, Vingerling JR, et al. Axial length growth and the risk of developing myopia in European children. Acta Ophthalmol. 2018 May;96(3):301-309. doi: 10.1111/aos.13603. Epub 2017 Dec 19. PMID: 29265742; PMCID: PMC6002955.
- Report of the Joint World Health Organization–Brien Holden Vision Institute Global Scientific Meeting on Myopia University of New South Wales, Sydney, Australia 16–18 March 2015, https://myopiainstitute.org/wp-content/uploads/2020/10/Myopia_report_020517.pdf (last access 25.5.2025)
- MiGeL Limitationen, https://augenoptik-netzwerk.ch/migel-limitation-myopie-management/ (last access 25.5.2025)
- SOG-SSO Arbeitsgruppe Strabismus, SOG Anwendung MiGeL https://www.sog-sso.ch/fileadmin/user_upload/Datenablage/Arbeitsgruppe_Strabismus/SOG_Anwendung_MiGeL-Nr-v3.pdf (last access 25.5.2025)